Traded Volume on Bitcoin Exchanges
Presence of humans...
Sun Dec 01 23:00:00 UTC 2013
Like the FX markets (although obviously with only an insignificant tiny fraction of traded volume), bitcoin is traded 24/7. I was interested to determine a "trading day"/ open-close for 3 exchanges: mtgox (i am guessing mainly US based traders), bitstamp (europe), and finally, btc-china.
First, I obtained time-and-sales/trade (timestamp/price/volume) data for these 3 exchanges. Second, I split the trade data into 1 hour bins for the past -5 days from today (2013-12-01), resulting in 24*5 bins containing the total volume traded for each hour for each of the 3 exchanges in question. Next, as shown on the left in the below graph, I plotted the total volume along with a correlogram showing the autocorrelation of the hour by hour volume for the btc-china, mtgox and bitstamp exchanges (in that order) from top to bottom.
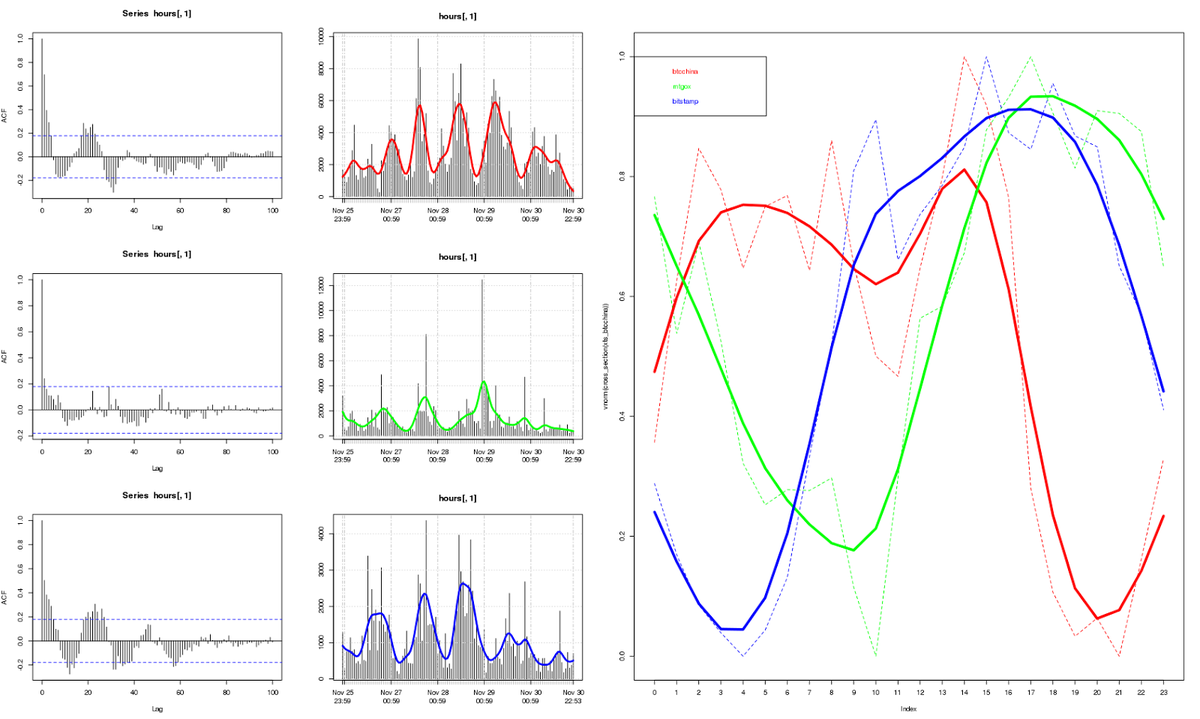
Immediately, it is obvious that the trading intensity varies depending on the time of day (as expected), and this intensity follows some kind of pattern or signal, the presence of which is confirmed in the left hand side correlograms for each of the exchanges.
The data was then split into 24*1 hour bins for each of the 3 exchanges, such that for each exchange a 24 hour cross section of volume data is created, where each 1-hour bin contains the average of the total traded volume for that hour for the past -500 days. For example, the first bin (12am - 1am) contains the average of all volume traded between 12am and 1am for the past -500 days. The result of this aggregation is shown in the right hand side of the above graph, colour coded by exchange. Here each series has been smoothed with a spline function, showing the relationship between the trading intensities of each of the 3 exchanges. As expected, the cross section of the traded volume over the 24 hour period corresponds roughly to the geographical location of exchange clientele. Yielding the following "trading days":
- mtgox: 10am-6pm UTC (5am-1pm central standard time)
- bitstamp: 4am-4pm UTC (5am-5pm central european time)
- btc-china: 9pm-2pm UTC (5am-10pm china standard time)
The shorter trading day for mtgox could be because the assumption that most of the clientele are US based is wrong, and that the data includes volume from elsewhere, including europe, which may explain the intersection of the peaks for mtgox and bitstamp between 4-6pm. An interesting observation from the btc-china cross-section is the existence of an intra-day peak at around midday localtime, and then an afternoon dip followed by a peak of activity at around 10pm local time indicative of 2 trading sessions: morning and evening.
Next, I was interested to see if in addition to an intra-day, hour-by-hour cyclical pattern, there existed an inter-day (day-by-day) pattern of trading intensity. To visualise this, I "expanded" the 3 cross-sections into 7*24*1 hour bins, such that the first bin contains the average of exchange traded volume on sundays 12am-1am. Resulting in the following graph:
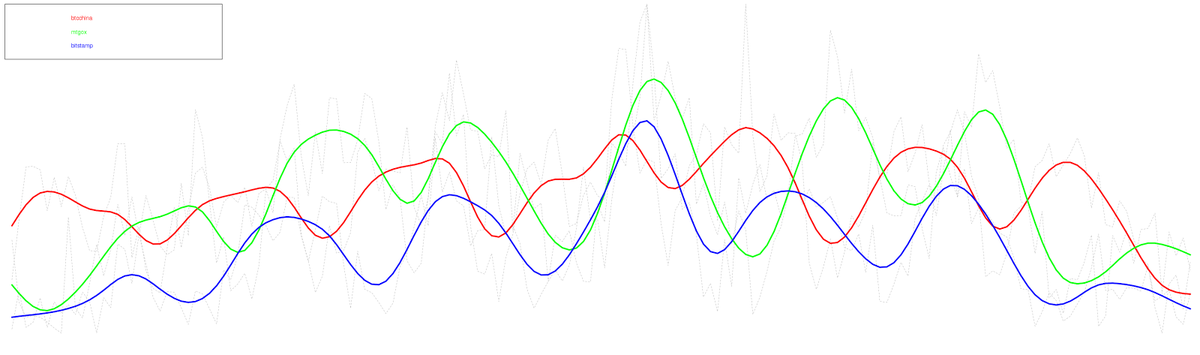
In this graph (apologies for the lack of axes: x = hour of week, y = volume), it is possible to see the lagged relationship between the 3 exchanges, for example, the trough in bitstamp trading activity preceeds the mtgox troughs (european trading starts first). In addition, it is relatively clear that on all 3 exchanges, trading activity declines at the weekend (left and right (sunday,saturday,...,saturday,sunday) tails of the graph) and seems to peak on wednesdays (in the centre of the graph).
The trading session of bitstamp (4am-4pm) best suites me (Side note: I would consider mtgox, but after examination of that particular exchange it seems highly amateur, and the fact that it was written apparently in PHP? is highly suspicious.) As such, here is a closer look at the volume cross section of bitstamp:
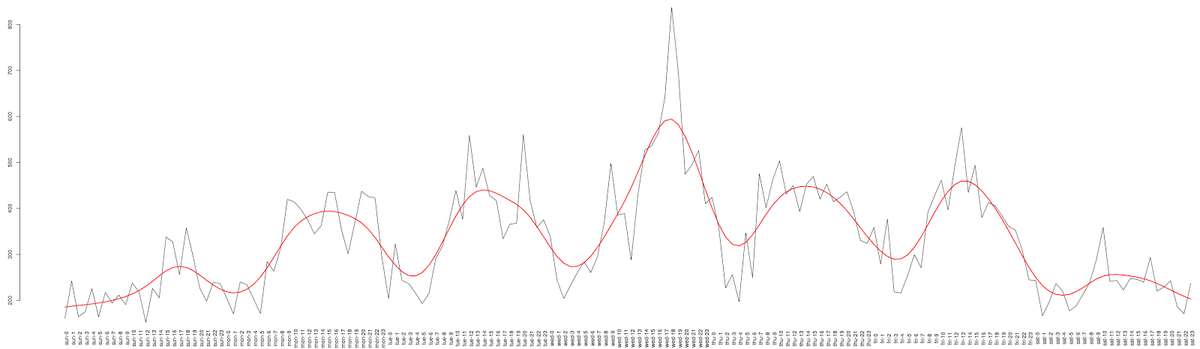
In the above graph, which shows the weekly cross section of volume for the past -500 days (24*7 1 hour bins) for the bitstamp exchange, the mid-week peak trading activity is more obvious. Also, more interesting is the slight peak of activity (in comparison to the previous day) on friday's at around noon - this could be due to traders closing out weekly positions? Of course closer examination is needed to answer that question.. Collapsing the weekly cross section into 24 1 hour bins for weekday activity and another 24 hour cross section for weekend activity, yields the following graphs:
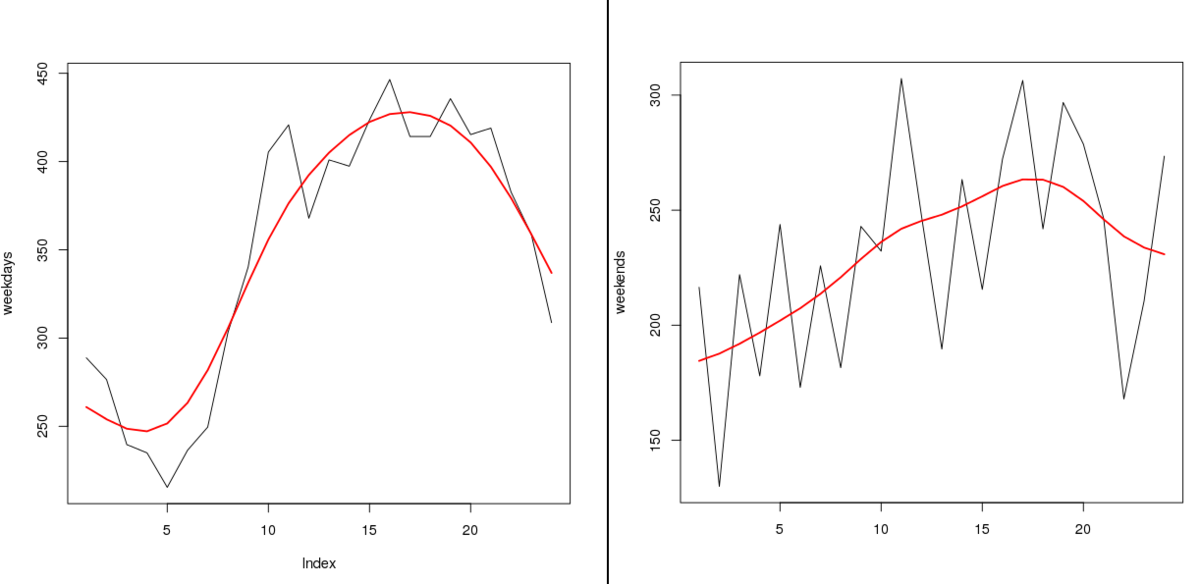
Here, the left graph shows the cross section of hourly averages excluding weekend data, whereas the right-hand-side graph is restricted to weekend data. Both graphs depict volume traded only on the bitstamp exchange. It is interesting to note the differences between the 2 cross sections. Firstly, the weekday data is more pronounced, and arguably more characteristic of some kind of "wave", whereas the weekend data, in addition to exhibiting less traded volume on average, is flatter and peaks slightly later during the day. (noted that of course the weekend data contains less data points..., so it is not really a "fair" comparison)
Random thoughts
Of course these graphs simply serve as visulisations of the trading data, although for the purposes of determining approximate trading sessions and quickly visualising the time lag relationships they suffice. It would be interesting to have a look to see if a cross section of intra-day volatility (quantified as standard deviation of period returns) would result in similar characteristics and if the well known "Volatility smile" is present as on conventional markets.
Although expected, the fact that there even exists a pattern in the intra-day traded volume is interesting in it's own right. The ACF/correlogram graphs show the presence of a signal which is most obvious in the final graph depicting the weekday 1 hour average volume cross section data for the bitstamp exchange.
The signal resembles a harmonic, which I think is probably the Circadian rhythm - In other words, since human activity is synchronised with the harmonic of the rising and setting sun ..with a few exceptions ;) , the signal reveals the presence of human activity on the exchanges.
If the presence of this harmonic is interpreted as the tell-tale-sign of human activity, then it would be interesting to see if it's presence decays over time in proportion to the presence of increased algorithmic trading.